Personal Loan
 Check Eligibility
 Salaried Personal Loan
 EMI Calculator
 Account Aggregator
 Deals starting @99
 Min. 50% off
 Bajaj Pay
 Wallet to Bank
 Easy EMI Loan
 Savings Offer
 Smartphones
 Led TVs
 Washing Machines
 Laptops
 Refrigerators
 Air Conditioner
 Air Coolers
 Loan Against Shares
 Loan Against Mutual Funds
 Loan Against Insurance Policy
 ESOP Financing
 Easy EMI Loan
 Buy a Used Car
 New Tractor Loan
 Two-wheeler Loan
 Loan for Lawyer
 Industrial Equipment Finance
 Industrial Equipment Balance Transfer
 Industrial Equipment Refinance
 Personal Loan Branch Locator
 Used Tractor Loan
 Loan Against Tractor
 Tractor Loan Balance Transfer
 Flexi
Flexi View All
 Two-wheeler Loan
 Bike
Bike Commuter Bike
 Sports Bike
 Tourer Bike
 Cruiser Bike
 Adventure Bike
 Scooter
 Electric Vehicle
 Best Sellers
 Popular Brands

 Trading Account
 Open Demat Account
 Margin Trading Financing
 Share Market
 Invest in IPO
 All stocks
 Top gainers
 Top losers
 52 week high
 52 week low
 Loan against shares
 Home Loan
 Transfer your existing Home loan
 Loan against Property
 Home Loan for Salaried
 Home loan for self employed
 Loan Against Property Balance Transfer
 Home Loan EMI Calculator
 Home Loan eligibility calculator
 Home Loan balance transfer
 View All
 Term Life Insurance
 ULIP Plan
 Savings Plan
 Family Insurance
 Senior Citizen Health Insurance
 Critical Illness Insurance
 Child Health Insurance
 Pregnancy and Maternity Health Insurance
 Individual Health Insurance
 Low Income Health Insurance
 Student Health Insurance
 Group Health Insurance
 Retirement Plans
 Child Plans
 Investment Plans
 Business Loan
 Secured Business Loan
 Loan against property
 Loans against property balance transfer
 Loan against shares
 Home Loan
 Loans against mutual funds
 Loan against bonds
 Loan against insurance policy
 Apply for Gold Loan
 Transfer your Gold Loan with Us
 Gold Loan Branch Locator
 ULIP Plan
 Savings Plan
 Retirement Plans
 Child Plans
 Free Demat Account
 Invest in Stocks
 Invest in IPO
 Margin Trading Facility
 Fixed Deposit Branch Locator
 New Car Loan
 Used Car Loan
 Loan Against Car
 Car Loan Balance Transfer and Top-up
 My Garage
 Get Bajaj Prime
 Mobiles on EMI
 Electronics on EMI Offer
  Iphone on EMI
 LED TV on EMI
 Refrigerator on EMI
 Laptop on EMI
 Kitchen appliances on EMI
 Washing machines
 Personal Loan EMI Calculator
 Personal Loan Eligibility Calculator
 Home Loan EMI Calculator
 Home Loan Eligibility Calculator
 Good & Service Tax (GST) Calculator
 Flexi Day Wise Interest Calculator
 Flexi Transaction Calculator
 Secured Business Loan Eligibility Calculator
 Fixed Deposits Interest Calculator
 Two wheeler Loan EMI Calculator
 New Car Loan EMI Calculator
 Used Car Loan EMI Calculator
 All Calculator
 Used Tractor Loan EMI Calculator
 Hot Deals
 Clearance Sale
 Kitchen Appliances
 Tyres
Tyres Camera & Accessories
 Mattresses
 Furniture
 Watches
 Music & Audio
 Cycles
 Mixer & Grinder
 Luggage & Travel
 Fitness Equipment
 Fans
Fans
 Personal Loan for Doctors
 Business loan for Doctors
 Home Loan
 Secured Business Loan
 Loan against property
 Secured Business Loan Balance Transfer
 Loan against share
 Gold Loan
 Medical Equipment Finance
 Smart Hub
 ITR Service
 Digi Sarkar
 Savings Offer
 Easy EMI
 Offer World
 1 EMI OFF
 New Launches
 Zero Down Payment
 Clearance Sale
 Bajaj Mall Sale
 Mobiles under ₹20,000
 Mobiles under ₹25,000
 Mobiles under ₹30,000
 Mobiles under ₹35,000
 Mobiles under ₹40,000
 Mobiles under ₹50,000
 Articles
 Overdue Payments
 Other Payments
 Document Center
 Bank details & Documents
 Tax Invoice Certificate
 Do Not Call Service
 Hamara Mall Orders
 Your Orders
 Explore Bajaj Prime
 Explore Rewards
 Buy Deals & Gift cards
 Fixed Deposit (IFA) Partner
 Loan (DSA) Partner
 Debt Management Partner
 EMI Network Partner
 Became a Merchant
 Partner Sign-in
 Trade directly with your Demat A/c
 ITR
ITR My Garage
 Live Videos - Beta
 Savings Offer
 Smartphones
 LED TVs
 Washing Machines
 Laptops
 Refrigerators
 Air Conditioners
 Air Coolers
 Water Purifiers
 Tablets
 Kitchen Appliances
 Mattresses
 Furniture
 Music and Audio
 Cameras & Accessories
 Cycle
Cycle Watches
 Tyres
Tyres Luggage & Travel
 Fitness Equipment
 Tractor
 Easy EMI Loan
 vivo Mobiles
 OPPO Mobiles
 Xiaomi Mobiles
 Sony LED TVs
 Samsung LED TVs
 LG LED TVs
 Haier LED TVs
 Godrej Refrigerators
 Voltas Washing Machines
 New Tractor Loan
 Used Tractor Loan
 Loan Against Tractor
 Tractor Loan Balance Transfer
 New Car Loan
 New Cars Under ₹10 Lakh
 New Cars – ₹10–₹15 Lakh
 New Cars – ₹15–₹20 Lakh
 New Cars – ₹20–₹25 Lakh
 New Car Brands
 Petrol – New Cars
 Diesel – New Cars
 Electric – New Cars
 CNG – New Cars
 Hybrid – New Cars


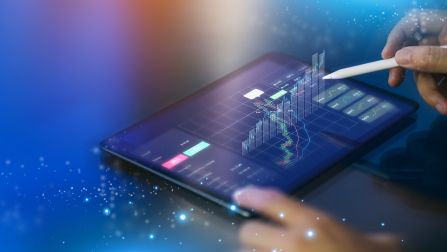
Investors who make profits from their stock investments base their success on extensive research about the company. Most investors analyse the technical and fundamental factors affecting the company to analyse the stocks in the best way possible. Technical analysis is the process of analysing stocks based on their historical price movements, trading volumes, and chart patterns to predict future price trends. On the other hand, fundamental analysis is the process of evaluating companies based on their financials. Within the process of technical analysis, there are two important indicators known as the double top and double bottom chart pattern.
This blog will help you understand how to read the double top and double bottom patterns to ensure you can pick profitable stocks based on ideal technical analysis.